The race within the race: California's 2026 governor primary
Becerra just took the lead, but that's not really the story. The story is the second ticket, and where the few million uncounted ballots actually live. So I built a county-by-county model you can poke at.
Here's where the count sits, with about 3,089,950 ballots still out:
| Candidate | Party | Votes | Share |
|---|---|---|---|
| Xavier Becerra | D | 1,721,926 | 26.8% |
| Steve Hilton | R | 1,694,477 | 26.3% |
| Tom Steyer | D | 1,354,921 | 21.1% |
| Chad Bianco | R | 692,273 | 10.8% |
| Katie Porter | D | 289,368 | 4.5% |
| Matt Mahan | D | 247,982 | 3.9% |
In California's top-two primary the top two finishers advance to November no matter their party, so first place is almost beside the point. Becerra is locked into one of the two slots. The live fight is the second ticket: Hilton (R) vs Steyer (D), and right now Hilton leads Steyer for it by 339,556. The whole question is how the remaining ballots break.
The blue shift is real, but it points the wrong way for Steyer
California's late ballots lean Democratic, because Republicans vote early and the mail counted last skews younger and more Latino. That's helped Becerra climb past Hilton for first. But it's a Democrat-vs-Republican effect: it lifts Democrats as a group, and it does not, on its own, move Steyer past Becerra. For Steyer to grab the second ticket he needs two separate things at once: the Republican vote to fade (so Hilton drops), and to start winning the late Democratic vote (which Becerra, not he, has been taking).
The quick version
Before the county data, here's the back-of-envelope geometry. Fix Becerra's share of the remaining and ask: at each combination of Steyer's and Hilton's share of what's left, who gets the second ticket? Steyer only wins the green corner, and the white dot (if the remaining just mirrors the count so far) sits deep in Hilton's territory.
Statewide back-of-envelope (Becerra fixed at 27% of the remaining). The real answer depends on where the ballots are, which is the next part.
The real model: turn the dials, county by county
This is the heart of it. Two levers, applied to each county's own baseline and summed across all 58, using NBC's actual per-county estimate of the ballots still out:
Advanced: minor-Dem fade (Porter/Mahan)
Where the remaining vote actually lives
This is why the dials behave the way they do. If most of what's left were in the Bay Area, Steyer would have a real lane. It isn't. The two biggest blocks are GOP-heavy SoCal and the Central Valley, where Hilton banks late votes, and Los Angeles, which is Becerra's anchor.
| Region | Remaining | % of remaining | Steyer Dem-split | GOP share |
|---|---|---|---|---|
| SoCal (non-LA) | 889,000 | 28.8% | 41% | 45% |
| Bay Area | 734,000 | 23.8% | 47% | 24% |
| Los Angeles | 632,000 | 20.5% | 44% | 29% |
| Central Valley | 592,600 | 19.2% | 41% | 48% |
| Central Coast | 128,200 | 4.1% | 50% | 36% |
| North/Rural | 114,150 | 3.7% | 52% | 55% |
Counties where Steyer actually leads Becerra among Democrats hold only about 11% of the remaining vote; Los Angeles alone is ~20%.
One more check, since the whole thing leans on NBC's remaining estimates: I stress-tested them. Even if you shove 30 to 60 percent more of the uncounted vote into the Bay Area (and out of the interior), Hilton still holds the second ticket. So the read doesn't depend on NBC's county numbers being exactly right.
So how likely is each outcome?
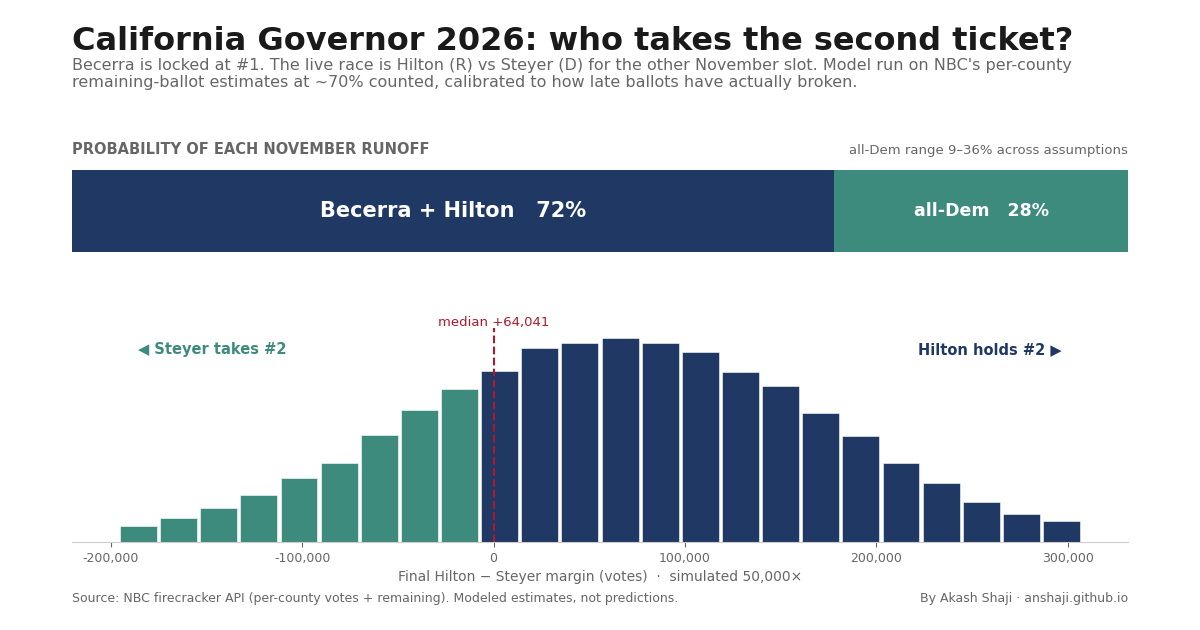
The dials are point scenarios. For an actual probability I ran 50,000 simulations, letting the two levers vary around where the data says they sit. I pinned that down by differencing the vote snapshots over the past few days: each fresh batch of counted ballots is a read on how the remaining is breaking, and so far that's a genuine blue shift (the GOP runs about three-quarters as strong late as in the count) with Steyer essentially flat on the Democratic split. The all-Democrat number swings from roughly 2% to 27% depending on how much room you give that second lever, the one thing that hasn't really moved yet.
The bottom line
The county data, calibrated to how ballots are actually breaking, says Becerra + Hilton, around 83%. Steyer's roughly one-in-six path exists only if he starts winning the late Democratic vote, which he hasn't in a single batch so far (Becerra keeps taking the bigger share). The geography and the behavior point the same way.
A few caveats worth stating plainly. NBC's per-county remaining is itself an estimate, not a count. The smaller candidates are bucketed rather than modeled one by one. The projection assumes each county keeps roughly its current lean as the rest of its ballots land, which is exactly the thing the two levers flex. And to be clear, these are modeled estimates for fun, not a prediction of who wins.
Update · June 7, ~70% counted
How the model is tracking as the count grows
I've been checking the model against each new batch as it lands, and the most recent one is a good test. About 272,000 votes took the count from ~67.7% to ~70.1%, and that batch broke almost exactly the way the two-lever framework expects, on the lever that matters most.
Steyer stayed flat on the late Democratic vote: he won 45.7% of the Becerra-plus-Steyer ballots in that batch, against the 44% he was already running, a +1.6 point nudge versus the +1.7 my calibration assumed. Just about exact. The blue shift did run a little stronger than my central number, with the GOP taking about 26% of the batch against 37% of the count so far (Lever A near 0.30, above my 0.25 center). So Becerra extended his lead for first, from +27k to +64k. And while Hilton's second-place lead over Steyer shrank in raw votes (340k → 318k), as a share of the ballots still out it is essentially flat at about 11%. Steyer beat Hilton in the batch, just not by the ~11 points he would need to actually catch up.
Folding that batch in and re-centering the levers moved the model's own number from the ~1-in-6 all-Democrat chance I started with toward ~1-in-4 now. Worth being clear: that shift is almost entirely because the blue shift is running stronger than I first assumed, not because Steyer's own position improved.
Update · June 11 — the race is called
Becerra and Hilton advance. Here's how the model did.
It's over. At 95.6% counted, Xavier Becerra (28.0%) and Steve Hilton (24.9%) have taken the two tickets to November. Tom Steyer finished third at 22.6%, about 198,000 votes behind Hilton for the second slot, with only ~411,000 ballots left. He'd have to win those scraps by nearly fifty points to catch up, so the race got called. The November runoff is Becerra (D) vs. Hilton (R), exactly the matchup this model pointed at from the first day.
The interesting part isn't that the call was right, it's how the second-ticket race actually closed. Steyer's blue surge was front-loaded and then faded. In the big middle batch he beat Hilton by about +10 points and clawed roughly 127,000 off the gap, which is what made the race look genuinely live for a stretch. But in the final 1.08 million ballots he beat Hilton by only +1.2 points, nowhere near the +12 he needed just to hold pace. His share of the late Becerra-versus-Steyer vote in that last batch was 44.6%, below the 48% he'd been running and well under the ~51% the model said he needed to flip it. He decelerated into the finish instead of accelerating.
And that final batch is the whole thesis of this project in one line: Becerra 31.4%, Steyer 25.2%, Hilton 24.0%. Becerra ran away with the late vote, his strongest batch of the entire count, while Steyer and Hilton ran roughly even. The blue shift was real and it was strong (it knocked Hilton from 27.5% in early June down to 24.9%), but it flowed to the first Democrat, not the third. Steyer always needed to beat Becerra among late Democrats, and outside San Francisco and a couple of Bay counties he never did.
The honest scorecard. Every version of this model called Becerra + Hilton, and Becerra's first-place finish was never in doubt. Where I'll grade myself harder is the probability. My original county forecast (around 83% Becerra + Hilton) turned out to be the best-calibrated one. The recalibrations I ran mid-count, which drifted toward a near-tossup, were over-fit to those hot middle batches: I let a strong few-day surge talk me into treating it as the new normal, and the late vote reverted. The lesson I'm keeping: a couple of blue batches in the middle aren't a trend, and mean-reversion in the tail is the base rate. The fundamentals (geography, plus who actually wins late Democrats) held the line, and the conservative call stood.
Per-county votes + NBC remaining estimates (the model's single input). The model and forecast code is plain Python/JS; happy to share it.